Geospatial Analysis of Amazon Fulfillment Centers
Mapping the Geospatial Distribution of AFC's
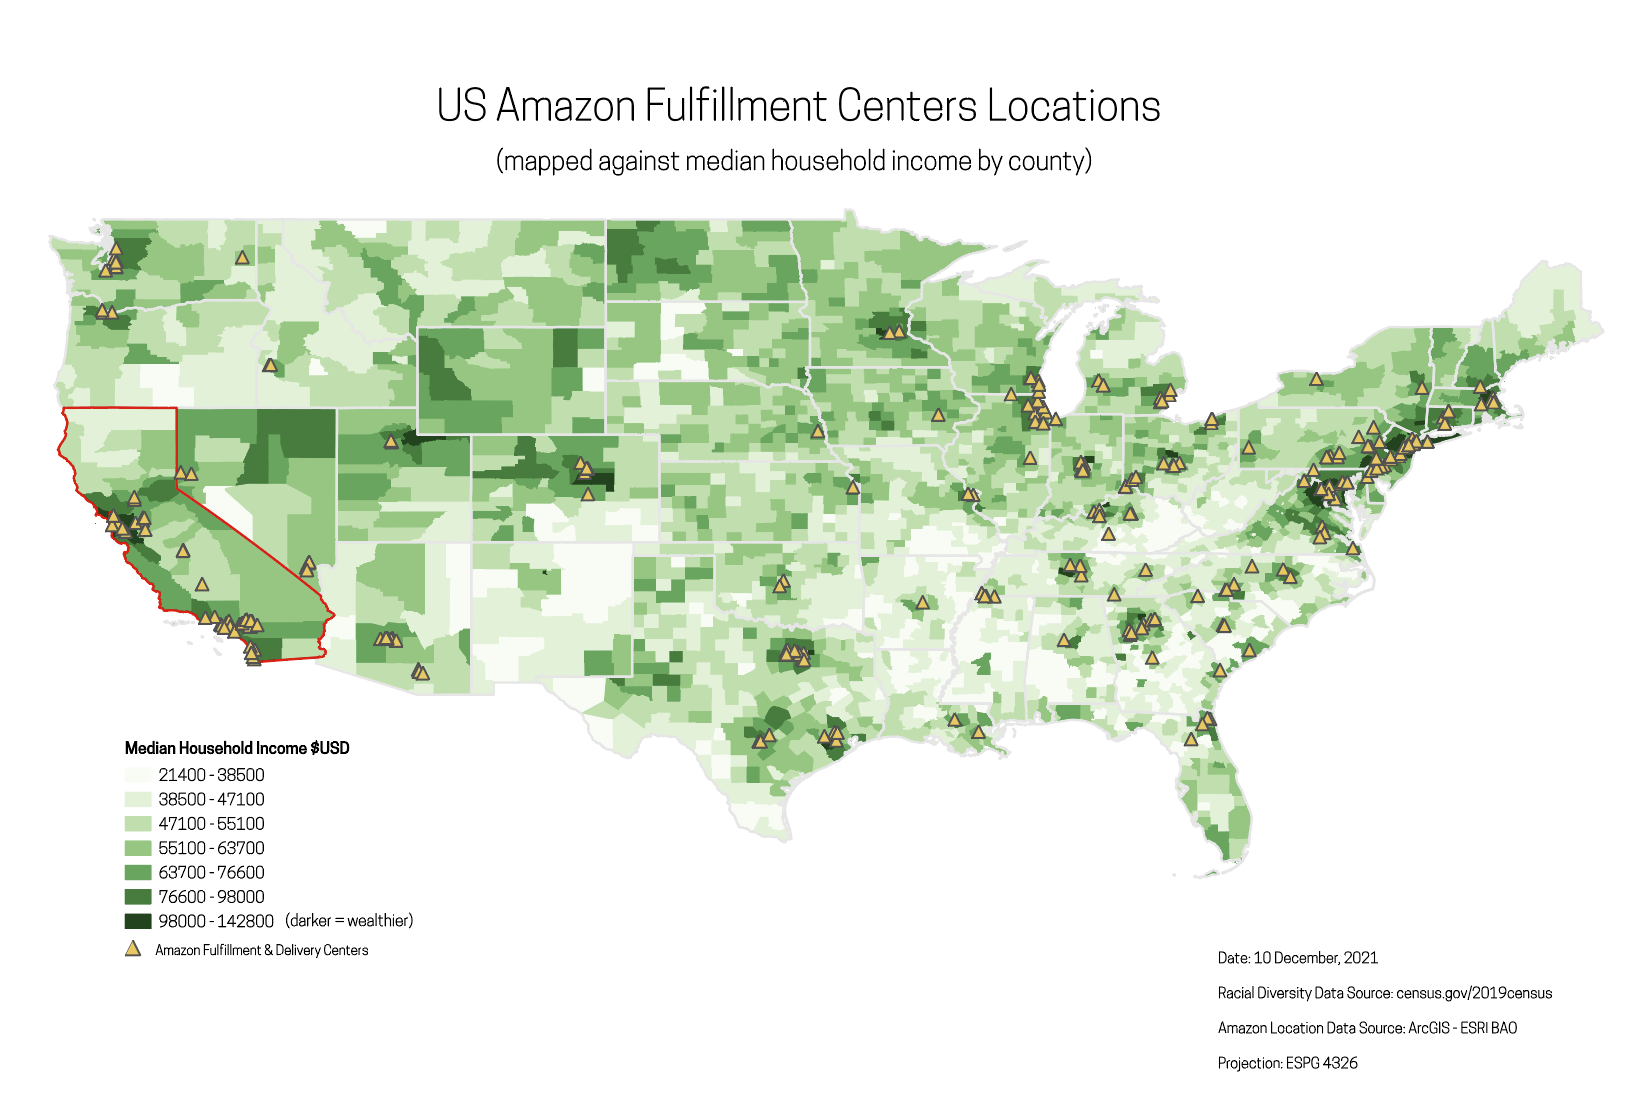
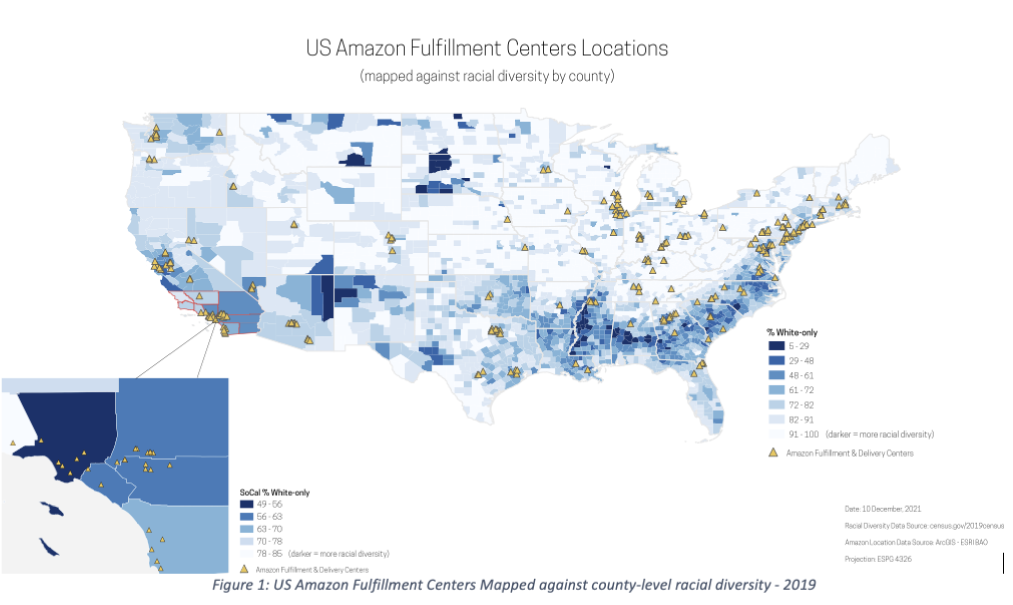
Overview: The report analyzes socio-economic characteristics of areas around Amazon Fulfillment Centers (AFCs) using QGIS geospatial tools and 2019 US Census Bureau and American Community Survey data. AFCs tend to locate in higher income and less racially diverse counties at the national level, but within lower income and more racially diverse areas in Inland Empire zip codes.
What I did: The study uses QGIS geospatial tools to analyze data at the county and zip code levels, using Median Household Income and % White as socio-economic measures. Data was sourced from the 2019 US Census Bureau and American Community Survey and analyzed using R/Python for data manipulation and cleaning & QGIS for visualization.
Result: AFCs tend to locate in higher income and less racially diverse counties at the national level, but in lower income and more racially diverse areas in Inland Empire zip codes. The report discusses these findings and their impact on current literature, and suggests possible improvements in logic and scope for future research. The report aims to add a geospatial context to ongoing research on Amazon’s expansion and provide a foundation for future studies.


